5.7 Managing Nondetects in Statistical Analyses
Environmental statistics is constrained by a practical reality of laboratory analysis: it is technically impossible for a laboratory analysis to confirm the complete absence of a chemical or compound of interest. Instead, a chemical may be present at some unknown concentration below the low end of the concentration rangeThe difference between the largest value and smallest value in a dataset (NIST/SEMATECH 2012). that the analysis is able to detect. Since the true level is unknown, laboratories report the nonzero value representing the lowest concentration that can be reliably detected for the given analytical method. This alternate value is often used in environmental statistical applications, even though the true value can only be narrowed to a range of possible concentrations (for example, from zero up to the reporting limit).
5.7.1 Definition of Detection Limits
In environmental testing, a detection limit is the concentration that is statistically greater than the concentration of a method blank with a high level of confidence (typically, 99%), or the lowest level of a given chemical that can be positively identified when using a particular analytical method. Signal intensity below the detection limit cannot be reliably distinguished from a method blank or “baseline noise.” Therefore, an analyte is confidently reported as present in an environmental sample only when the measured concentration is greater than the detection limit.
Statisticians refer to any threshold at which a nondetect is reported as a “censoring limit.” Nondetects are sometimes referred to as censored values. Censoring limits affect how one should manage data. For instance, reporting nondetectsLaboratory analytical result known only to be below the method detection limit (MDL), or reporting limit (RL); see "censored data" (Unified Guidance). to larger censoring limits (higher detection limits) than needed tends to adversely impact data quality and increase data uncertainty. Unfortunately, different environmental testing laboratories use different types of censoring limits and reporting conventions for nondetects. No standard industry practice exists for establishing censoring limits.
Often the method detection limit (MDL) described in 40 CFRCode of Federal Regulations Part 136, Appendix B is used as one of the censoring limits. The MDL is designed to minimize false positives (that is, reporting a compound as present when it is really not). Another common censoring limit is the reporting limit which typically refers to the smallest concentration at which analytical results will likely achieve specified or acceptable tolerances for precision and biasSystematic deviation between a measured (observed) or computed value and its true value. Bias is affected by faulty instrument calibration and other measurement errors, systematic errors during data collection, and sampling errors such as incomplete spatial randomization during the design of sampling programs (Unified Guidance).. The reporting limit is generally larger than the MDL and is also referred to as a “quantitation limit” or “limit of quantitation.” Detected results less than the reporting limit (but larger than the MDL) may be reported with “J” flags (or “qualifiers”) to denote their lack of quantitative reliability.
In general, a measured concentration (detect) greater than the MDLmethod detection limit but less than the reporting limit only reliably demonstrates the chemical is present in the sample at some concentration significantly greater than that of a method blank. Nevertheless, it is generally preferable to utilize qualified detections at their measured values in statistical evaluations — despite their greater analytical uncertainty — rather than treating them as censored values reported to a reporting limit (that is, less than values). Too much statistical information is lost by converting such detections to higher censored values.
Reporting conventions differ from laboratory to laboratory, and often nondetects are reported to the reporting limit (usually noted as "< RL") instead of the lowest detectable measurement. Therefore, prior to processing data containing nondetects, consult the laboratory (or an environmental chemist) to evaluate the thresholds to which nondetects are reported.
Good statistical evaluations attempt to minimize data censoring both in terms of the proportions of censored values (nondetects) and the magnitudes of the censoring limits. This practice frequently avoids potential problems and simplifies statistical calculations. No statistical technique can fully compensate for the information loss due to data censoring. The larger the proportion of censored dataValues that are reported as nondetect. Values known only to be below a threshold value such as the method detection limit or analytical reporting limit (Helsel 2005). and the larger the censoring limits, the greater the information loss and uncertainty. Some analytical methods (such as metals analyzed by inductively coupled plasma spectroscopy) — at times referred to as ‘uncensored methods’ — are capable of reporting numerical values for method blanks. With these methods, negative values may sometimes be obtained for method blanks, even though negative concentrations are not physically meaningful as individual values. However, this practice is acceptable and expected when random measurement variability is present and the ‘true’ meanThe arithmetic average of a sample set that estimates the middle of a statistical distribution (Unified Guidance). is equal (or nearly equal) to zero (a similar pattern may be observed in measurements of radionuclides). Remember that statistical decisions and results are based on the aggregate information contained in a data set, and not on any single estimated value. Because detection and reporting limits often change over time with improved analytical methods, or because differing levels of turbidity or interference may necessitate sample-specific reporting limits, many data sets contain multiple reporting limits. Observations in the same data set that are censored at differing levels present additional statistical complexity. However, special methods for handling such data have been developed (see Section 5.7.6, Section 5.7.7, and Section 5.7.8).
5.7.2 Managing Nondetects
Despite considerable research in recent years on handling nondetects, regulatory agencies have published no comprehensive guidance on the recommended approach to use in a particular situation. As a result, approaches to handling nondetects in groundwater projects vary widely.
The following are the general strategies for handling nondetects:
- Use statistical approaches specifically designed to accommodate nondetects, such as the Tarone-Ware two-sample alternative to the t-test.
- Use a rank-based, nonparametricStatistical test that does not depend on knowledge of the distribution of the sampled population (Unified Guidance). test, such as the Mann-Kendall trend test.
- Use a censored estimation technique to estimate sample statistics, such as the Kaplan-Meier method for calculating an upper confidence limit on the mean.
- Impute an estimated value for each nondetect prior to further statistical analysis.
The most commonly used methods are described in the sections below.
5.7.3 Use of Nonparametric Methods
Nonparametric methods that treat nondetects as inequalities are probably the most versatile and effective approach for handling censored data sets. Some of these methods, such as the Tarone-Ware test, are specifically designed to accommodate censored data. Others entail ordering the measurements (from smallest to largest) and replacing the values with their corresponding ranks. Nondetects are treated as ‘ties’ and are assigned the same rank (without substituting any imputed or surrogate values). The advantage of nonparametric methods over parametricA statistical test that depends upon or assumes observations from a particular probability distribution or distributions (Unified Guidance). methods is that a specific (parametric) distribution is not assumed. The Wilcoxon rank-sum (Chapter 16.2, Unified Guidance) and Kruskal-Wallis tests (Chapter 17.2.2, Unified Guidance)—which test whether the medians of two or more environmental populations differ significantly—are examples of rank-based nonparametric tests that can be used for data sets which contain nondetects.
Tips regarding nonparametric methods include the following:
- A larger number of data points are generally required for nonparametric methods to achieve the same level of confidence and false positive rateThe frequency at which false positive or Type I error occurs. The false positive rate, or α (alpha), is the significance level of a hypothesis test. If a test is at an α = 0.01 level of significance there would be a 1% chance that a Type I error would occur (Unified Guidance). control as parametric methods.
- Although nonparametric methods can tolerate a relatively large proportion of censored values, they generally lose significant statistical powerStrength of a test to identify an actual release of contaminated groundwater or difference from a criterion (Unified Guidance). if most of the data are censored.
- There is a distinction between nonparametric methods based on ranks (such as Wilcoxon rank-sum) and those based on counting values below a threshold (for instance, Tarone-Ware or test of proportions). Ranking methods assume that the data can be fully sorted and ranked (apart from ties). If a large proportion of the data is tied due to nondetects, an alternative strategy may be needed.
- Generalizations can be difficult to make because there are many types of nonparametric tests and their ‘robustness’ to data censoring depends on the nature of test. For example, it is problematic to compare medians (50th percentiles) when more than 50% of the results are censored, but comparisons of larger (e.g., 95th) percentiles may be possible.
A commonly encountered problem is how to estimate a linear trend when some of the data are censored. In some cases, a trend may be suspected from a time series plotA graphic of data collected at regular time intervals, where measured values are indicated on one axis and time indicated on the other. This method is a typical exploratory data analysis technique to evaluate temporal, directional, or stationarity aspects of data (Unified Guidance). (see Figure 5-14) when in reality most or all of the data are nondetect and reporting limits have decreased due to improved analytical techniques. In others, correct identification of a trend and its apparent slope may depend on appropriate handling of the censored values. Assigning each nondetect to, say, half the reporting limit will not properly account for the analytical uncertainty of the data set, especially if some of the reporting limits are elevated due to dilution factors or poorer historical precision.
Two alternatives include Turnbull’s method and the Akritas-Theil-Sen technique (both discussed in Helsel 2012). Turnbull’s method extends the Mann-Kendall trend test to censored data by computing a slope and significance test for the slope that is equivalent to testing whether Kendall’s tau is different from zero. Akritas-Theil-Sen similarly extends the nonparametric Theil-Sen trend method to properly account for censored data by computing the slope that makes a Theil-Sen trend line estimate applied to the trend residuals (what is left over after subtracting out the trend) equal to zero. Application of Turnbull’s method to the example benzene data shown in Figure 5-14 gives a nonsignificant Kendall’s tau value of 0.01, demonstrating that the apparent trend is illusory, a function of decreasing reporting limits but not a real change in concentration levels over time.
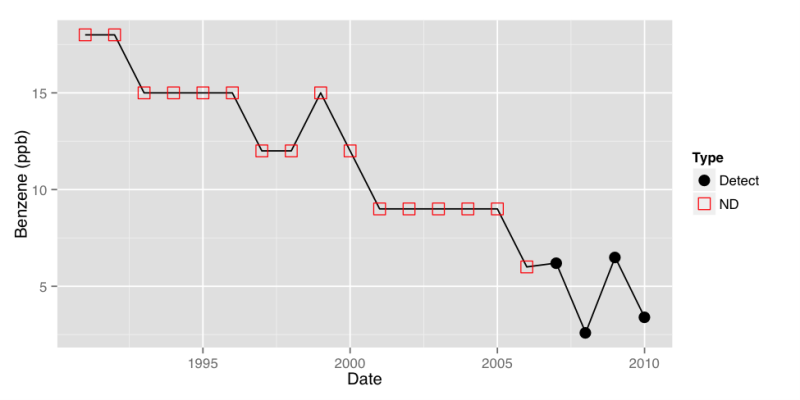
Figure 5-14. Example time series plot of benzene data with nondetects.
5.7.4 Omission of Nondetects
Omitting nondetects from a statistical analysis can bias outcomes and prevent the statistical tests from detecting real differences (thus decreasing the statistical power of the method). However, there are select circumstances in which it may be permissible to omit nondetects. For example, suppose a large number of measurements are available, only a small percentage of the data is nondetect, and the censoring limit is much smaller than the site’s risk-based decision criterionGeneral term used in this document to identify a groundwater concentration that is relevant to a project; used instead of designations such as Groundwater Protection Standard, clean-up standard, or clean-up level.. Under those conditions, if a statistical evaluation using only the detections indicates that contamination is present at levels significantly below the decision criterion, the omission of nondetects is unlikely to affect the outcome.
As a more general rule, nondetects should not be omitted but rather utilized and properly accounted for. The presence of nondetects provides valuable information about an environmental population. Eliminating nondetects often results in inaccurate test outcomes and can lead to greatly elevated mean or medianThe 50th percentile of an ordered set of samples (Unified Guidance). concentration estimates and, importantly, underestimated variances. In addition, a large proportion of nondetects all well below a risk-based decision criterion constitutes strong evidence for the absence of significant contamination (regardless of whether a statistical evaluation can be done).
5.7.5 Simple Substitution Method
In the simple substitution method, proxy or surrogate numerical values are assigned to each of the nondetects. The surrogate value for each nondetect is typically some fraction of the censoring limit (such as one half the detection limit or reporting limit). The impact of using simple substitution for nondetects depends greatly on what kind of statistical evaluation is to be performed. If the goal is to compute summary statistics such as the mean or varianceThe square of the standard deviation (EPA 1989); a measure of how far numbers are separated in a data set. A small variance indicates that numbers in the dataset are clustered close to the mean. (or quantities that depend on these statistics) — particularly for larger data sets or those with more than a low percentage of nondetects — it may be inappropriate to impute the censoring limit (or some fraction of this limit) to nondetects in statistical formulas because the substitution method distorts the data. In these cases, simple substitution can produce erroneous conclusions, particularly for data sets with very low concentrations or a large number of nondetects. For example, substituting the censoring limit for nondetects could result in a sample mean that is biased high, and substituting zero could result in a mean that is biased low, while simultaneously causing the variance to be either overestimated or underestimated.
In such applications, you should treat each nondetect as an inequality rather than a fixed numerical value. Although substituting one-half the censoring limit(s) for nondetects may not bias the mean, it can adversely affect estimates of the variance and statistics such as the upper confidence limit on the mean (which depends on the variance). Furthermore, the magnitudes of the substitutions — and perhaps the statistical evaluation itself — will depend on how the laboratory reports nondetects, including the size of the censoring limits, rather than on the actual but unknown concentrations in those samples. In general, the larger the fraction of nondetects and the more elevated the reporting limits, the greater the distortion of the data.
EPA’s Unified Guidance suggests that the substitution method can be acceptable when only a small portion of the data set (10-15 percent) consists of nondetects. When the nondetect proportion is quite low, statistical results based on using simple substitution are not likely to vary substantially from other methods. However, it also recommends more sophisticated methods be used to handle nondetects for any larger data set when summary statistics are needed. For descriptive and graphical purposes, simple substitution may also be used to present preliminary summary statistics such as the sample mean and variance (for instance, when quantitative statistical evaluations are not planned), or when creating graphs like time series plots.
One additional consideration is that simple substitution may work fairly well in cases where parametric prediction limitsIntervals constructed to contain the next few sample values or statistics within a known probability (Unified Guidance). are used with retesting to compare two populations (for instance, in release detection tests against backgroundNatural or baseline groundwater quality at a site that can be characterized by upgradient, historical, or sometimes cross-gradient water quality (Unified Guidance).). Simulation studies have shown that simple substitution worked better than or as well as more complicated methods in that particular setting (McNichols and Davis 1988; Gibbons 1994; Gibbons and Coleman 2001), as long as the censoring proportion was not too high (more than 50%) and retesting was utilized as part of the test.
5.7.6 Kaplan-Meier Method
The Kaplan-Meier method is a nonparametric technique for calculating the (cumulative) probability distribution and for estimating means, sums, and variances with censored data. Originally, the Kaplan-Meier approach was developed for right-censored survival data. More recently, the method was reformulated for left-censored environmental measurements (e.g., nondetects). USEPA’s Unified Guidance also recommends the Kaplan-Meier method for use as an intermediate step in calculating parametric prediction limits, control chartsGraphical plots of compliance measurements over time; alternative to prediction limits (Unified Guidance)., and confidence limits for censored data sets. In this latter application, the Kaplan-Meier estimate of the mean and variance is substituted for the sample mean and variance in the appropriate parametric formula.
Kaplan-Meier is one of a class of ‘counting’ techniques useful for accommodating censored data. It counts the number of data points below each detected concentration, and uses that information to generate an estimate of the probability distribution function. Kaplan-Meier accounts for the fact that data sets with nondetects can only be partially ranked (e.g., while a value of <5 is presumably less than a detected concentration of 10, it is not possible to determine whether or not it exceeds a detected concentration of 2). To get around this difficulty, the method only determines how many data values cannot exceed any given detected level. Once the (cumulative) probability distribution is estimated, statistics of interest like the mean or variance can be computed via areas under the distributional curve.
- Kaplan-Meier is most commonly used to calculate summary statistics like means and variances. It can be used in conjunction with bootstrapping and other methods to calculate upper confidence limits (UCLs) on the mean.
- The Kaplan-Meier method can also be used to sum data that include both censored and non-censored values. This approach is often used in environmental data when calculating toxicity equivalency (TEQ) for dioxins and benzo(a)pyrene equivalents.
- The Kaplan-Meier approach can also be used to improve parametric estimates of quantities like prediction and control chart limits that require means and standard deviations and an estimate of the cumulative distribution function (CDF) properly adjusted for the presence of nondetects. This strategy is discussed in USEPA’s Unified Guidance.
- Kaplan-Meier is nonparametric, so it does not assume the data follow a known distribution.
- When applied as an intermediate step to calculate parametric statistics, Kaplan-Meier assumes that all data values come from a single underlying (non-negative) statistical population. In particular, contaminants are assumed to be present in nondetects at some low level not readily quantified by the analytical method.
- To calculate Kaplan-Meier, you must have at least three detected concentrations, more than one reporting limit, and a detected value larger than all censored data. At least 8-10 measurements with no more than 50-70% nondetects are recommended. Note: if there is only one reporting limit, Kaplan-Meier is equivalent to simple substitution at the reporting limit, a strategy known to bias estimates of the mean and variance.
- This method can only include censored data less than the highest detected value, so be sure to consider information about censored data with high detection limits. The Kaplan-Meier method cannot rank censored data points with reporting limits above the highest detected concentration. Thus Kaplan-Meier may not give accurate estimates in data sets with elevated reporting limits (perhaps due to high dilution factors during chemical analysis). One possible solution is to count the highest censored value as a detected concentration. This approach will tend to bias the mean upward but still allow computation of the Kaplan-Meier probability distribution.
- Another potential problem occurs when the lowest value is a censored value. Because estimates of the Kaplan-Meier (cumulative) probability distribution are only reported at the levels of detected concentrations, the distribution of censored data below the lowest detected value is unknown and not estimated. You can use Efron’s bias correction to reduce the bias that occurs in this case. For this correction, simply convert the lowest censored data point to a detected value. Use care when performing this bias correction to ensure that the modified data point is ranked below other censored data points at the same reporting limit.
- Kaplan-Meier is well-suited for many environmental data sets because it is nonparametric, so that no underlying distribution need be assumed.
- Kaplan-Meier can accommodate multiple reporting limits and is routinely used with data sets having a lower than 50% detection frequency.
- One weakness of Kaplan-Meier is that it cannot rank censored data points with reporting limits above the highest detected concentration.
- Another weakness is that if only one reporting limit is present, Kaplan-Meier is equivalent to simple substitution at the reporting limit.
Additional information on how to implement the Kaplan-Meier method and tools for calculating Kaplan-Meier distributions and sample means can be found in the Unified Guidance, the ProUCL documentation, and Helsel (2012). Helsel (2012) includes details on calculation of the mean and standard deviation using Kaplan-Meier methods. Beal (2009) presents an SAS macro for implementing the Kaplan-Meier method.
Consider the following data set:
20, 20, 10, 1, <0.5, <0.5, <25, <0.5, <2, <2, 1, 100, 30, 3, <3, 2, <25, 1, 3, 5
Order this data set in decreasing order: 100, 30, <25, 20, 20, 10, <10, 5, 3, 3, <3, 2, <2, <2, 1, 1, 1, <0.5, <0.5, <0.5
Apply Efron’s bias correction:
100, 30, <25, 20, 20, 10, <10, 5, 3, 3, <3, 2, <2, <2, 1, 1, 1, <0.5, <0.5, 0.5 (note that the lowest censored data point, <.5, was converted to 0.5)
The highest value is a detected concentration at 100 and the data set includes 20 total data points. Since 19 data points are below 100, the probability of getting a data point less than 100 is 19/20 = 0.95.
The next highest data point is 30, which is also a detected concentration. Once the value of 100 is removed from the data set, the probability of getting a value below 30 is 18/19 = 0.947. The location of 30 on the probability distribution function is obtained by multiplying its probability by the probability of the next highest detected value: 0.95 * 18/19 = 0.90.
The next highest detected value is 20. Two data points are detected with concentrations at 20. Once all the detected and censored data points above 20 are removed, the probability of getting a value below 20 is 15/17 = 0.882. The location of 20 on the probability distribution function is 0.90 * (15/17) = 0.794.
This exercise can be continued to generate this probability distribution table:
| Value | Probability |
|---|---|
|
100 |
0.95 |
|
30 |
0.9 |
|
20 |
0.794118 |
|
10 |
0.741176 |
|
5 |
0.684163 |
|
3 |
0.570136 |
|
2 |
0.506787 |
|
1 |
0.253394 |
|
0.5 |
0 |
When graphed, it looks like this:
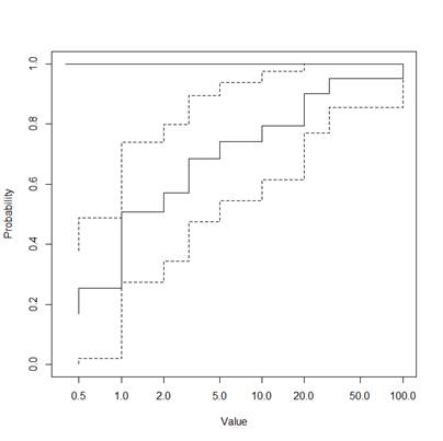
Figure 5-15. Kaplan-Meier method example data plot.
Integrate the area under this curve to determine a sample mean of 10.281.
5.7.7 Robust Regression on Order Statistics
Robust regression on order statistics (ROS) is a semi-parametric method that can be used to estimate means and other statistics with censored data. Unlike Kaplan-Meier, ROS internally assumes that the underlying population is approximately normal or lognormalA dataset that is not normally distributed (symmetric bell-shaped curve) but that can be transformed using a natural logarithm so that the data set can be evaluated using a normal-theory test (Unified Guidance).. However, the assumption is directly applied to only the censored measurements and not to the full data set (hence the term ‘semi-parametric’). In particular, ROS plots the detected values on a probability plot (with a regular or log-transformed axis) and calculates a linear regression line in order to approximate the parameters of the underlying (assumed) distribution. This fitted distribution is then utilized to generate imputed estimates for each of the censored measurements, which are then combined with the known (detected) values to summary statistics of interest (e.g., mean, variance). The method is labeled ‘robust’ because the detected measurements are used ‘as is’ to make estimates, rather than simply using the fitted distributional parameters from the probability plot.
- Robust ROS is most commonly used to estimate summary statistics like means and variances. It can be used in conjunction with bootstrapping and other methods to calculate upper confidence limits (UCLs) on the mean.
- ROS can also be used to improve parametric estimates of quantities like prediction and control chart limits that require means and standard deviations, properly adjusted for the presence of nondetects. This strategy is discussed in the Unified Guidance.
- To compute ROS, at a minimum, there must be at least three detected values and a detection frequency greater than 50%. More realistically, you should have at least 8-10 measurements.
- Robust ROS is semi-parametric. It assumes that the detected data can be fit to a known distribution on a probability plot, from which imputations are made for the nondetects. The estimated summary statistics are computed from a combination of the known and imputed measurements, rather than from the parameters of the fitted model.
- ROS assumes that all data values come from a single underlying (non-negative) statistical population. In particular, contaminants are assumed to be present in nondetects at some low level not readily quantified by the analytical method.
Robust ROS will impute a value for each censored data point. However, these estimated values should not be used for any additional calculations other than estimating summary statistics for the data set as a whole.
- Robust ROS is widely applicable to many environmental data sets. However, as a semi-parametric method, you must be able to fit a known distributional model to the detected measurements on a probability plot.
- ROS can accommodate multiple reporting limits as well as (unlike Kaplan-Meier) a single reporting limit.
Additional information on how to implement the Robust ROS method and tools for calculating statistics using the Robust ROS method can be found in Chapter 15.4, Unified Guidance, in the ProUCL documentation, and Helsel (2012).
Consider the following data set, then list in descending order:
Starting at the highest detection limit, determine the probability of exceeding that percentile. For example, in the data set above with 24 values, the probability of exceeding the detection limit of 2 is 1 – 22/24 = 0.083333.
The remaining probability (0.9166667) is divided up evenly between the 8 values with a censoring limit of 2, resulting in probabilities of 0.8148, 0.7130, 0.6111, 0.5093, 0.4074, 0.3056, 0.2037, and 0.1019 assigned to these 8 samples.
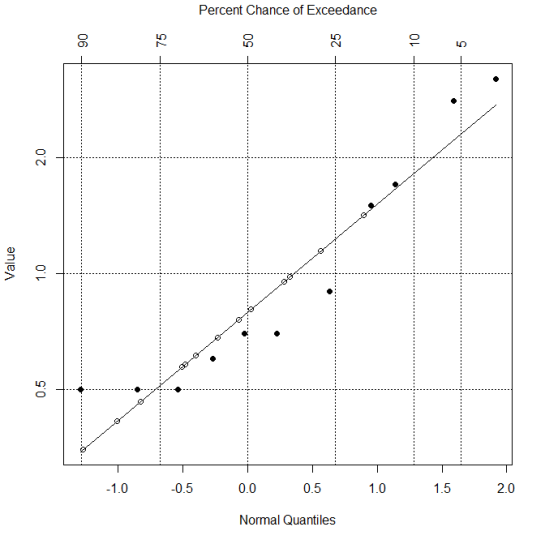
Once this process has been completed for all detection limits, a regression line is fit to the detected portion of the data set. Then values are picked off the regression line and used as estimated concentrations for each censored data point.
This process results in a data set as shown in the following table:
The mean of the estimated data set (rightmost column in the table above) is 0.9725.
This data set is shown graphically below, where closed data points show detected concentrations and open data points show estimated concentrations for censored data points.
5.7.8 Maximum Likelihood Estimation (Including Cohen's Method)
Maximum likelihood estimation (MLE) is a parametric, model-based method that can be used to estimate means and other summary statistics with censored data. In this approach, you must know or assess what distribution (such as normal or lognormal) will best model the data set. The model parameters for that distribution (mean and variance) are then estimated by maximizing the likelihood of the observed values, while simultaneously treating each nondetect as an inequality. Once the model parameters are determined, other statistics can be estimated from the model.
Cohen’s method (Chapter 15.5.1, Unified Guidance) is a simplified application of the MLE approach, where the underlying model is assumed to be normal (or transformed to normality) and the data contain but a single reporting limit, with all detected values larger than the nondetects.
The MLE approach (including Cohen’s method) is most commonly used to estimate means and variances in larger data sets with known or assumed distributions. It can be used in conjunction with bootstrapping and other methods to calculate upper confidence limits (UCLs) around the mean. The mean and variance estimates (adjusted for censoring) can also be used in parametric formulas for prediction limits and control charts.
- To use MLEmaximum likelihood estimation, the sample size must be large enough to assess the best-fitting underlying distribution. With multiple reporting limits, you might need at least 50 data points and a detection frequency greater than 50%. Cohen’s method can be used with somewhat smaller data sets due to its more stringent assumptions.
- Data analyzed using MLE (including Cohen’s method) are assumed to follow a known distribution, since the calculations depend explicitly on the assumed model. Distributional fitting using MLE works best on data sets with no obvious outliersValues unusually discrepant from the rest of a series of observations (Unified Guidance). and — if a normal model is assumed — that are not significantly skewed.
- Application of MLE assumes that nondetects are distributed in a manner similar to the detected values. Accurate estimates can only be anticipated when a common distributional model is valid for the both the detects and nondetects.
MLEmaximum likelihood estimation will perform poorly if a well-fitted or closely matching distribution cannot be found to model the underlying population. Censored probability plots and other goodness-of-fit techniques should be utilized to help assess this critical assumption.
- The general MLEmaximum likelihood estimation approach can handle multiple reporting limits and can be a rigorous way to estimate summary statistics of data sets when the sample size is sufficiently large. Cohen’s method requires there to be only a single reporting limit.
- If the underlying distribution is known, MLE will explicitly account for distribution type in calculating estimates. If the assumed model is incorrect, MLE may lead to misleading results.
- MLE is most generally applicable to larger data sets (n > 50) with high detection frequencies. Under the stricter assumptions of Cohen’s method, model-based mean and variance estimates can be computed with relatively high censoring rates (up to 50-80%).
Additional information on how to implement Cohen’s method can be found in Chapter 15.5, Unified Guidance.
Publication Date: December 2013